Logarithms: a bit of history (and the main rules)

Pre-scriptum (dated 26 June 2020): This post did not suffer much – if at all – from the attack by the dark force—which is good because I still like it. Enjoy !

Original post:

This post will probably be of little or no interest to you. I wrote it to get somewhat more acquainted with logarithms myself. Indeed, I struggle with them. I think they come across as difficult because we don’t learn about the logarithmic function when we learn about the exponential function: we only learn logarithms later – much later. And we don’t use them a lot: exponential functions pop up everywhere, but logarithms not so much. Therefore, we are not as familiar with them as we should be.

The second point issue is notation: x = loga(y) looks more terrifying than y = ax because… Well… Too many letters. It would be more logical to apply the same economy of symbols. We could just write x = ay instead of loga(y), for example, using a subscript in front of the variable–as opposed to a superscript behind the variable, as we do for the exponential function. Or, else, we could be equally verbose for the exponential function and write y = expa(x) instead of y = ax. In fact, you’ll find such more explicit expressions in spreadsheets and other software, because these don’t take subscripts or superscripts. And then, of course, we also have the use of the Euler number e in eand ln(x). While it’s just a real number, is not as familiar to us as π, and that’s again because we learned trigonometry before we learned advanced calculus.

Historically, however, the exponential and logarithmic functions were ‘invented’, so to say, around the same time and by the same people: they are associated with John Napier, a Scot (1550–1617), and Henry Briggs, an Englishman (1561–1630). Briggs is best known for the so-called common (i.e. base 10) logarithm tables, which he published in 1624 as the Arithmetica Logarithmica. It is logical that the mathematical formalism needed to deal with both was invented around the same time, because they are each other’s inverse: if y = ax, then x = loga(y).

These Briggs tables were used, in their original format more or less, until computers took over. Indeed, it’s funny to read what Feynman writes about these tables in 1965: “We are all familiar with the way to multiply numbers if we have a table of logarithms.” (Feynman’s Lectures, p. 22-4). Well… Not any more. And those slide rules, or slipsticks as they were called in the US, have disappeared as well, although you can still find circular slide rules on some expensive watches, like the one below.

It’s a watch for aviators, and it allows them to rapidly multiply numbers indeed: the time multiplied by the speed will give a pilot the distance covered. Of course, there’s all kinds of intricacies here because we’ll measure time in minutes (or even seconds), and speed in knots or miles per hour, and so that explains all the other fancy markings on it. 🙂 In case you have one, now you know what you’re paying for! A real aviator watch! 🙂

Captureasset-version-16f0646efa-navitimer-01-1

How does it work? Well… These slide rules can be used for a number of things but their most basic function is to multiply numbers indeed, and that function is based on the logb(ac) = logb(a) + logb(c). In fact, this works for any base so we can just write log(ac) = log(a) + log(c). So the numbers on the slide rule below are the a, b and c. Note that the slides start with 1 because we’re working with positive numbers only and log(1) = 0, so that corresponds with the zero point indeed. The example below is simple (2 times 3 is six, obviously): it would have been better to demonstrate 1.55×2.35 or something. But you see how it goes: we add log(2) and log(3) to get log(6) = log(2×3). For 1.55×2.35, the slider would show a position between 3.6 and 3.7. The calculator on my $30 Nokia phone gives me 3.6425. So, yes, it’s not far off. However, it’s hard to imagine that engineers and scientists actually used these slide rules over the past 300 years or so, if not longer.

403px-Slide_rule_example2_with_labels

Of course, Briggs’ tables are more accurate. It’s quite amazing really: he calculated the logarithms of 30,000 (natural) numbers to to fourteen decimal places. It’s quite instructive to check how he did that: all he did, basically, was to calculate successive square roots of 10.

Huh?

Yes. The secret behind is the basic rule of exponentiation: exponentiation is repeated multiplication, and so we can write: am+n =aman and, more importantly, am–n = ama–n = am/an. Because Briggs used the common base 10, we should write 10m–n = 10m/10n. Now Briggs had a table with the successive square roots of 10, like the one below (it’s only six significant digits behind the decimal point, not fourteen, but I just want to demonstrate the principle here), and so that’s basically what he used to calculate the logarithm (to base 10) of 30,000 numbers! Talking patience ! Can you imagine him doing that, day after day, week after week, month after month, year after year? Waw !

Capture

So how did he do it? Well… Let’s do it for x = log10(2) = log(2). So we need to find some x for which 10x = 2. From the table above, it’s obvious that log(2) cannot be 1/2 (= 0.5), because 101/2 = 3.162278, so that’s too big (bigger than 2). Hence, x = log(2) must be smaller than 0.5 = 1/2. On the other hand, we can see that x will be bigger than 1/4 = 0.25 because 101/4 = 1.778279, and so that’s less than 2.

In short, x = log(2) will be between 0.25 (= 1/4) and 0.5. What Briggs did then, is to take that 101/4 factor out using the 10m–n = 10m/10n formula indeed:

10x–0.25 = 10x/100.25 = 2/1.778279 = 1.124683

If you’re panicking already, relax. Just sit back. What we’re doing here, in this first step, is to write 2 as

2 = 10x = 10[0.25 + (x–0.25)] = 101/410x–0.25 = (1.778279)(1.124683)

[If you’re in doubt, just check using your calculator.] We now need log(10x–0.25) = log(1.124683). Now, 1.124683 is between 1.154782 and 1.074608 in the table. So we’ll use the lowest value (101/32) to take another factor out. Hence, we do another division: 1.124683/1.074608 = 1.046598. So now we have 2 = 10x = 10[1/4 + 1/32 + (x – 1/4 – 1/32)] = (1.778279)(1.074608)(1.046598).

We now need log(10x–1/4–1/32) = log(1.046598). We check the table once again, and see that 1.046598 is bigger than the value for 101/64, so now we can take that 101/64 value out by doing another division. (10x–1/4–1/32)/101/64 = 1.046598/1.036633 = 1.009613. Waw, this is getting small! However, we can still take an additional factor out because it’s larger than the 1.009035 value in the table. So we can do another division: 1.009613/1.009035 = 1.000573. So now we have 2 = 10x = 10[1/4 + 1/32 + 1/64 + 1/256 + (x – 1/4 –1/32 – 1/64 –1/256)] = 101/4101/32101/64101/25610x–1/4–1/32–1/64–1/256 = (1.778279)(1.074608)(1.036633)(1.009035)(1.000573).

Now, the last factor is outside of the range of our table: it’s too small to find a fraction. However, we had a linear approximation based on the gradient for very small fractions x: 10= 1 + 2.302585·r. So, in this case, we have 1.000573 = 1 + 2.302585·r and, hence, we can calculate r as 0.000248. [I can shown where this approximation comes from: just check my previous posts if you want to know. It’s not difficult.] So, now, we can finally write the result of our iterations:

2 = 10x ≈ 10(1/4 + 1/32 + 1/64 + 1/256 + 0.000248)

So log(2) is approximated by 0.25 + 0.03125 + 0.015625 + 0.00390625 + 0.000248 = 0.30103. Now, you can check this easily: it’s essentially correct, to an accuracy of six digits that is!

Hmm… But how did Briggs calculate these square roots of 10? Well… That was done ‘by cut and try’ apparently! Pf-ff ! Talk of patience indeed ! I think it’s amazing ! And I am sure he must have kept this table with the square roots of 10 in a very safe place ! 🙂

So, why did I show this? Well… I don’t know. Just to pay homage to those 17th century mathematicians, I guess. 🙂 But there’s another point as well. While the argument above basically demonstrated the am+n = amaformula or, to be more precise, the am–n = am/an formula, it also shows the so-called product rule for logarithms:

logb(ac) = logb(a) + logb(c)

Indeed, we wrote 2 as a product of individual factors 10and then we could see the exponents r in all of these individual factors add up to 2. However, the more formal proof is interesting, and much shorter too: 🙂

  1. Let m = loga(x) and n = loga(y)
  2. Write in exponent form: x = aand y = an
  3. Multiply x and y: xy = aman = am+n
  4. Now take loga of both sides: loga(xy) = loga(am+n) = (m+n)loga(a) = m+n = loga(x) + loga(y)

You’ll notice that we used another rule in this proof, and that’s the so-called power rule for logarithms:

loga(xn)= nloga(x)

This power rule is proved as follows:

  1. Let m = loga(x)
  2. Write in exponent form: x = am
  3. Raise both sides to the power of n: xn = (am)n
  4. Convert back to a logarithmic equation: loga(xn)= mn
  5. Substitute for m = loga(x): loga(xn)= n loga(x)

Are there any other rules?

Yes. Of course, we have the quotient rule:

loga(x/y) = loga(x) – loga(y)

The proof of this follows the proof of the product rule, and so I’ll let you work on that.

Finally, we have the ‘change-of-base’ rule, which shows us how we can easily switch from one base to another indeed:

The proof is as follows:

  1. Let x = loga b
  2. Write in exponent form: a= b
  3. Take log c of both sides and evaluate:

log c ax = log c b
x
log c a = log c b

[I copied these rules and proofs from onlinemathlearning.com, so let me acknowledge that here. :-)]

Is that it? Well… Yes. Or no. Let me add a few more lines on these logarithmic scales that you often encounter in various graphs. It the same scale as those logarithmic scales used for that slide that we showed above but it covers several orders of magnitude, all equally spaced: 1, 10, 100, 1000, etcetera, instead of 0, 1, 2, 3, etcetera. So each unit increase on the scale corresponds to a unit increase of the exponent for a given base (base 10 in this case): 101, 102, 103, etcetera. The illustration below (which I took from Wikipedia) compares logarithmic scales to linear ones, for one or both axes.

Logarithmic_Scales

So, on a logarithmic scale, the distance from 1 to 100 is the same as the distance from 10 to 1000, or the distance from 0.1 to 10, or the distance between any point that’s 100 (= 102) times another point. This is easily explained by the product rule, or the quotient rule rather:

log(10) – log(0.1) = log(101/1–1) = log(102) = 2

= log(1000) – log(10) = log(103/11) = log(102/) = 2

= log(100) – log(1) = log(102/100) = log(102) = 2

And, of course, we could say the same for the distance between 1 and 1000, and 0.1 and 100. The distance on the scale is 3 units here, while the point is 1000 = 10the other point.

Why would we use logarithmic scales? Well… Large quantities are often better expressed like that. For example, the Richter scale used to measure the magnitude of an earthquake is just a base–10 logarithmic scale. With magnitude, we mean the amplitude of the seismic waves here. So an earthquake that registers 5.0 units on the Richter scale has a ‘shaking amplitude’ that is 10 times greater than that of an earthquake that registers 4.0. Both are fairly light earthquakes, however: magnitude 7, 8 or 9 are the big killers. Note that, theoretically, we could have earthquakes of a magnitude higher than 10 on the Richter scale: scientists think that the asteroid that created the Chicxulub crater created a cataclysm that would have measured 13 on Richter’s scale, and they associate it with the extinction of the dinosaurs.

The decibel, measuring the level of sound, is another logarithmic unit, so the power associated with 40 decibel is not two times but one hundred times that of 20 decibel!

Now that we’re talking sound, it seems that logarithmic scales are more ‘natural’ when it comes to human perception in general, but I’ll let you have fun googling some more stuff on that! 🙂

Advertisement

Riemann surfaces (II)

Pre-scriptum (dated 26 June 2020): the material in this post remains interesting but is, strictly speaking, not a prerequisite to understand quantum mechanics. It’s yet another example of how one can get lost in math when studying or teaching physics. :-/

Original post:

This is my second post on Riemann surfaces, so they must be important. [At least I hope so, because it takes quite some time to understand them. :-)]

From my first post on this topic, you may or may not remember that a Riemann surface is supposed to solve the problem of multivalued complex functions such as, for instance, the complex logarithmic function (log z = ln r + i(θ + 2nπ) or the complex exponential function (zc = ec log z). [Note that the problem of multivaluedness for the (complex) exponential function is a direct consequence of its definition in terms of the (complex) logarithmic function.]

In that same post, I also wrote that it all looked somewhat fishy to me: we first use the function causing the problem of multivaluedness to construct a Riemann surface, and then we use that very same surface as a domain for the function itself to solve the problem (i.e. to reduce the function to a single-valued (analytic) one). Penrose does not have any issues with that though. In Chapter 8 (yes, that’s where I am right now: I am moving very slowly on his Road to Reality, as it’s been three months of reading now, and there are 34 chapters!), he writes that  “Complex (analytic) functions have a mind of their own, and decide themselves what their domain should be, irrespective of the region of the complex plane which we ourselves may initially have allotted to it. While we may regard the function’s domain to be represented by the Riemann surface associated with the function, the domain is not given ahead of time: it is the explicit form of the function itself that tells us which Riemann surface the domain actually is.” 

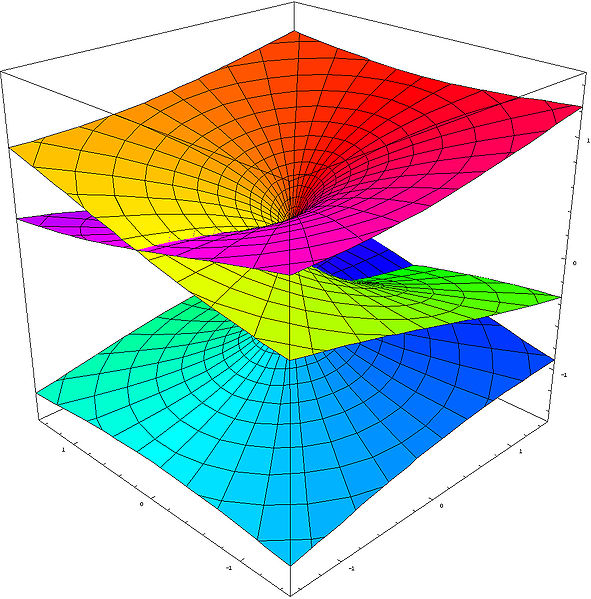
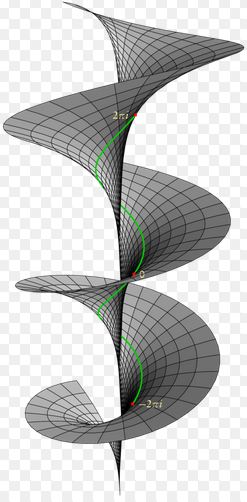
Let me retrieve the graph of the Riemannian domain for the log z function once more:

Riemann_surface_log

For each point z in the complex plane (and we can represent z both with rectangular as well as polar coordinates: z = x + iy = reiθ), we have an infinite number of log z values: one for each value of n in the log z = ln r + i(θ + 2nπ) expression (n = 0, ±1, ±2, ±3,…, ±∞). So what we do when we promote this Riemann surface as a domain for the log z function is equivalent to saying that point z is actually not one single point z with modulus r and argument θ + 2nπ, but an infinite collection of points: these points all have the same modulus ¦z¦ = r but we distinguish the various ‘representations’ of z by treating θ, θ ± 2π, θ ±+ 4π, θ ± 6π, etcetera, as separate argument values as we go up or down on that spiral ramp. So that is what is represented by that infinite number of sheets, which are separated from each other by a vertical distance of 2π. These sheets are all connected at or through the origin (at which the log z function is undefined: therefore, the origin is not part of the domain), which is the branch point for this function. Let me copy some formal language on the construction of that surface here:

“We treat the z plane, with the origin deleted, as a thin sheet Rwhich is cut along the positive half of the real axis. On that sheet, let θ range from 0 to 2π. Let a second sheet  Rbe cut in the same way and placed in front of the sheet R0. The lower edge of the slit in Ris then joined to the upper edge of the slit in R1. On  R1, the angle θ ranges from 2π to 4π; so, when z is represented by a point on R1, the imaginary component of log z ranges from 2π to 4π.” And then we repeat the whole thing, of course: “A sheet Ris then cut in the same way and placed in front of R1. The lower edge of the slit in R1. is joined to the upper edge of the slit in this new sheet, and similarly for sheets R3R4… A sheet R-1R-2, R-3,… are constructed in like manner.” (Brown and Churchill, Complex Variables and Applications, 7th edition, p. 335-336)

The key phrase above for me is this “when z is represented by a point on R1“, because that’s what it is really: we have an infinite number of representations of z here, namely one representation of z for each branch of the log z function. So, as n = 0, ±1, , ±2, ±3 etcetera, we have an infinite number of them indeed. You’ll also remember that each branch covers a range from some random angle α to α + 2π. Imagine a continuous curve around the origin on this Riemann surface: as we move around, the angle of z changes from 0 to 2θ on sheet R0, and then from 2π to 4π on sheet Rand so on and so on.

The illustration above also illustrates the meaning of a branch point. Imagine yourself walking on that surface and approaching the origin, from any direction really. At the origin itself, you can choose what to do: either you take the elevator up or down to some other level or, else, the elevator doesn’t work and so then you have to walk up or down that ramp to get to another level. If you choose to walk along the ramp, the angle θ changes gradually or, to put it in mathematical terms, in a continuous way. However, if you took the elevator and got out at some other level, you’ll find that you’ve literally ‘jumped’ one or more levels. Indeed, remember that log z = ln r + i(θ + 2nπ) and so ln r, the horizontal distance from the origin didn’t change, but you did add some multiple of 2π to the vertical distance, i.e. the imaginary part of the log z value. 

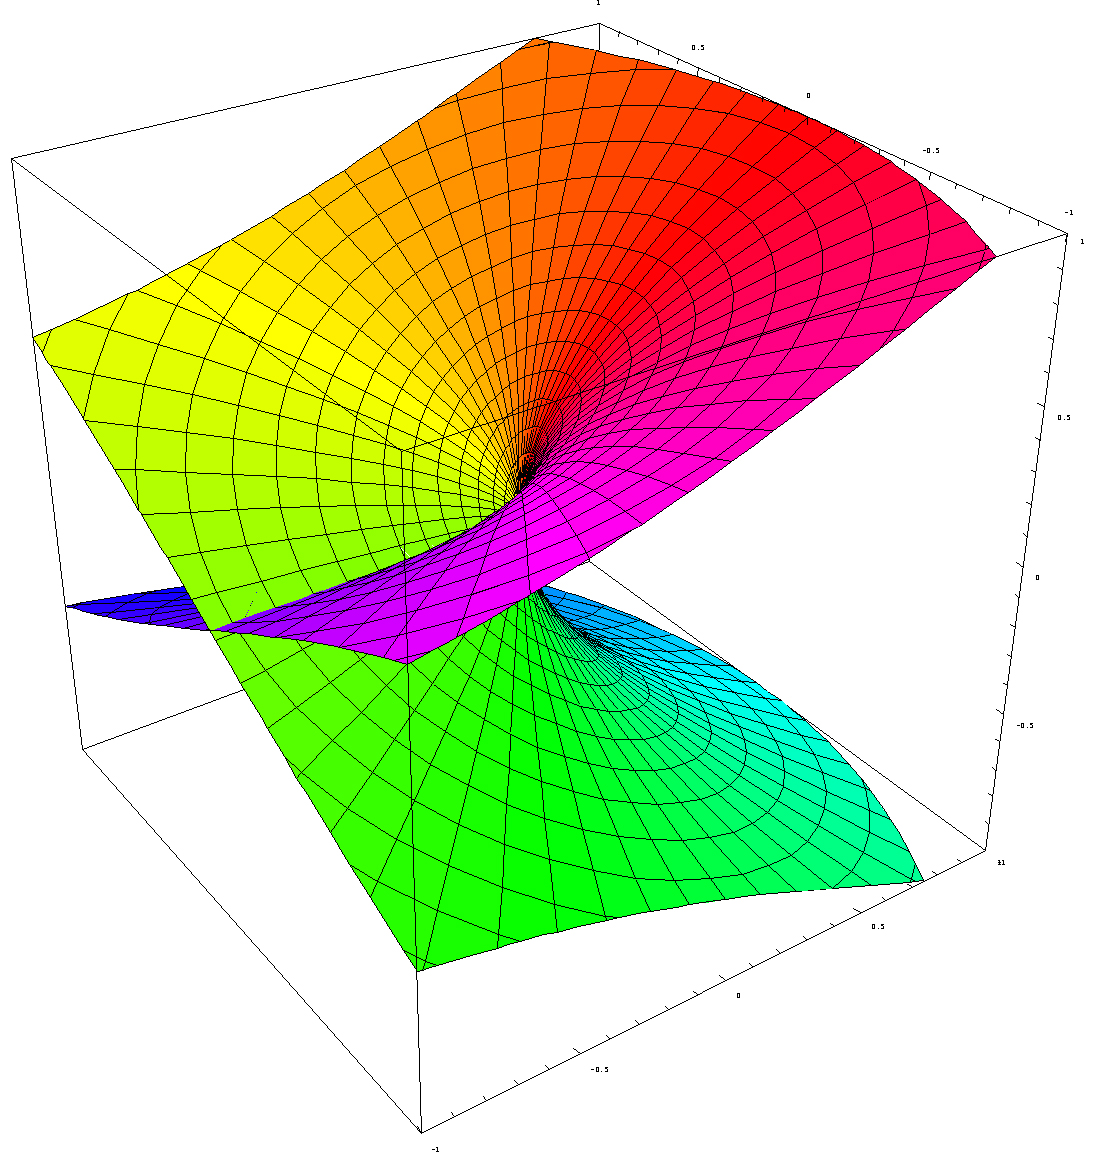
Let us now construct a Riemann surface for some other multiple-valued functions. Let’s keep it simple and start with the square root of z, so c = 1/2, which is nothing else than a specific example of the complex exponential function zc = zc = ec log z: we just take a real number for c here. In fact, we’re taking a very simple rational number value for c: 1/2 = 0.5. Taking the square, cube, fourth or  nth root of a complex number is indeed nothing but a special case of the complex exponential function. The illustration below (taken from Wikipedia) shows us the Riemann surface for the square root function.

Riemann_sqrt

As you can see, the spiraling surface turns back into itself after two turns. So what’s going on here? Well… Our multivalued function here does not have an infinite number of values for each z: it has only two, namely √r ei(θ/2) and √r ei(θ/2 + π). But what’s that? We just said that the log function – of which this function is a special case – had an infinite number of values? Well… To be somewhat more precise:  z1/2 actually does have an infinite number of values for each z (just like any other complex exponential function), but it has only two values that are different from each other. All the others coincide with one of the two principal ones. Indeed, we can write the following:

w = √z = z1/2 =  e(1/2) log z e(1/2)[ln r + i(θ + 2nπ)] = r1/2 ei(θ/2 + nπ) = √r ei(θ/2 + nπ) 

(n = 0, ±1,  ±2,  ±3,…)

For n = 0, this expression reduces to z1/2 = √r eiθ/2. For n = ±1, we have  z1/2 = √r ei(θ/2 + π), which is different than the value we had for n = 0. In fact, it’s easy to see that this second root is the exact opposite of the first root: √r ei(θ/2 + π) = √r eiθ/2eiπ = – √r eiθ/2). However, for n = 2, we have  z1/2 = √r ei(θ/2 + 2π), and so that’s the same value (z1/2 = √r eiθ/2) as for n = 0. Indeed, taking the value of n = 2 amounts to adding 2π to the argument of w and so get the same point as the one we found for n = 0. [As for the plus or minus sign, note that, for n = -1, we have  z1/2 = √r ei(θ/2 -π) = √r ei(θ/2 -π+2π) =  √r ei(θ/2 +π) and, hence, the plus or minus sign for n does not make any difference indeed.]

In short, as mentioned above, we have only two different values for w = √z = z1/2 and so we have to construct two sheets only, instead of an infinite number of them, like we had to do for the log z function. To be more precise, because the sheet for n = ±2 will be the same sheet as for n = 0, we need to construct one sheet for n = 0 and one sheet for n = ±1, and so that’s what shown above: the surface has two sheets (one for each branch of the function) and so if we make two turns around the origin (one on each sheet), we’re back at the same point, which means that, while we have a one-to-two relationship between each point z on the complex plane and the two values z1/2 for this point, we’ve got a one-on-one relationship between every value of z1/2 and each point on this surface.

For ease of reference in future discussions, I will introduce a personal nonsensical convention here: I will refer to (i) the n = 0 case as the ‘positive’ root, or as w1, i.e. the ‘first’ root, and to (ii) the n = ± 1 case as the ‘negative’ root, or w2, i.e. the ‘second’ root. The convention is nonsensical because there is no such thing as positive or negative complex numbers: only their real and imaginary parts (i.e. real numbers) have a sign. Also, these roots also do not have any particular order: there are just two of them, but neither of the two is like the ‘principal’ one or so. However, you can see where it comes from: the two roots are each other’s exact opposite w= u2 + iv= —w= -u1 – iv1. [Note that, of course, we have w1w = w12 = w2w = w2= z, but that the product of the two distinct roots is equal to —z. Indeed, w1w2 = w2w1 = √rei(θ/2)√rei(θ/2 + π) = rei(θ+π) = reiθeiπ = -reiθ = -z.]

What’s the upshot? Well… As I mentioned above already, what’s happening here is that we treat z = rei(θ+2π) as a different ‘point’ than z = reiθ. Why? Well… Because of that square root function. Indeed, we have θ going from 0 to 2π on the first ‘sheet’, and then from 2π0 to 4π on the second ‘sheet’. Then this second sheet turns back into the first sheet and so then we’re back at normal and, hence, while θ going from 0π  to 2π is not the same as θ going from 2π  to 4π, θ going from 4π  to 6π  is the same as θ going from 0 to 2π (in the sense that it does not affect the value of w = z1/2). That’s quite logical indeed because, if we denote w as w = √r eiΘ (with Θ = θ/2 + nπ, and n = 0 or ± 1), then it’s clear that arg w = Θ will range from 0 to 2π if (and only if) arg z = θ ranges from 0 to 4π. So as the argument of w makes one loop around the origin – which is what ‘normal’ complex numbers do – the argument of z makes two loops. However, once we’re back at Θ = 2π, then we’ve got the same complex number w again and so then it’s business as usual.

So that will help you to understand why this Riemann surface is said to have two complex dimensions, as opposed to the plane, which has only one complex dimension.

OK. That should be clear enough. Perhaps one question remains: how do you construct a nice graph like the one above?

Well, look carefully at the shape of it. The vertical distance reflects the real part of √z for n = 0, i.e. √r cos(θ/2). Indeed, the horizontal plane is the the complex z plane and so the horizontal axes are x and y respectively (i.e. the x and y coordinates of z = x + iy). So this vertical distance equals 1 when x = 1 and y = 0 and that’s the highest point on the upper half of the top sheet on this plot (i.e. the ‘high-water mark’ on the right-hand (back-)side of the cuboid (or rectangular prism) in which this graph is being plotted). So the argument of z is zero there (θ = 0). The value on the vertical axis then falls from one to zero as we turn counterclockwise on the surface of this first sheet, and that’s consistent with a value for θ being equal to π there (θ = π), because then we have cos(π/2) = 0. Then we go underneath the z plane and make another half turn, so we add another π radians to the value θ and we arrive at the lowest point on the lower half of the bottom sheet on this plot, right under the point where we started, where θ = 2π and, hence, Re(√z) = √r cos(θ/2) (for n = 0) = cos(2π/2) = cos(2π/2) = -1.

We can then move up again, counterclockwise on the bottom sheet, to arrive once again at the spot where the bottom sheet passes through the top sheet: the value of θ there should be equal to θ = 3π, as we have now made three half turns around the origin from our original point of departure (i.e. we added three times π to our original angle of departure, which was θ = 0) and, hence, we have Re(√z) = √r cos(3θ/2) = 0 again. Finally, another half turn brings us back to our point of departure, i.e. the positive half of the real axis, where θ has now reached the value of θ = 4π, i.e. zero plus two times 2π. At that point, the argument of w (i.e. Θ) will have reached the value of 2π, i.e. 4π/2, and so we’re talking the same w = z1/2 as when we started indeed, where we had Θ = θ/2 = 0.

What about the imaginary part? Well… Nothing special really (as for now at least): a graph of the imaginary part of √z would be equally easy to establish: Im(√z) = √r sin(θ/2) and, hence, rotating this plot 180 degrees around the vertical axis will do the trick.

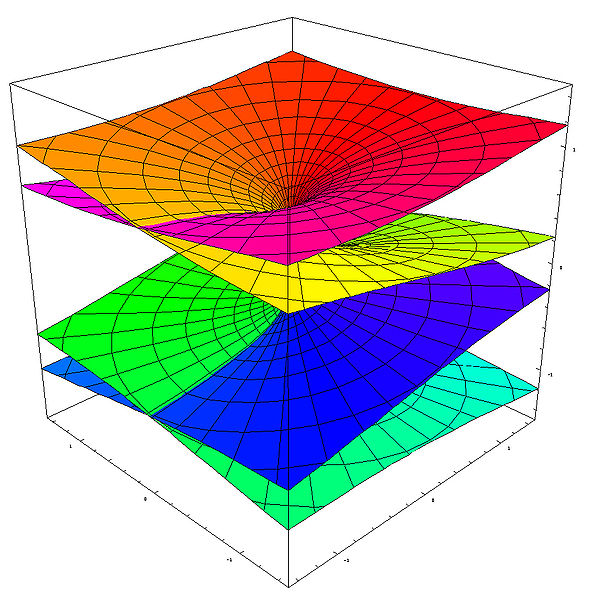
Hmm… OK. What’s next? Well… The graphs below show the Riemann surfaces for the third and fourth root of z respectively, i.e. z1/3 and z1/4 respectively. It’s easy to see that we now have three and four sheets respectively (instead of two only), and that we have to take three and four full turns respectively to get back at our starting point, where we should find the same values for z1/3 and z1/4 as where we started. That sounds logical, because we always have three cube roots of any (complex) numbers, and four fourth roots, so we’d expect to need the same number of sheets to differentiate between these three or four values respectively.

Riemann_surface_cube_rootRiemann_surface_4th_root

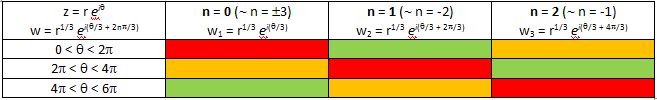
In fact, the table below may help to interpret what’s going on for the cube root function. We have three cube roots of z: w1, wand w3. These three values are symmetrical though, as indicated be the red, green and yellow colors in the table below: for example, the value of w for θ ranging from 4π to 6π for the n = 0 case (i.e. w1) is the same as the value of w for θ ranging from 0 to 2π for the n = 1 case (or the n = -2 case, which is equivalent to the n = 1 case).

Cube roots

So the origin (i.e. the point zero) for all of the above surfaces is referred to as the branch point, and the number of turns one has to make to get back at the same point determines the so-called order of the branch point. So, for w = z1/2, we have a branch point of order 2; for for w = z1/3, we have a branch point of order 3; etcetera. In fact, for the log z function, the branch point does not have a finite order: it is said to have infinite order.

After a very brief discussion of all of this, Penrose then proceeds and transforms a ‘square root Riemann surface’ into a torus (i.e. a donut shape). The correspondence between a ‘square root Riemann surface’ and a torus does not depend on the number of branch points: it depends on the number of sheets, i.e. the order of the branch point. Indeed, Penrose’s example of a square root function is w = (1 – z3)1/2, and so that’s a square root function with three branch points (the three roots of unity), but so these branch points are all of order two and, hence, there are two sheets only and, therefore, the torus is the appropriate shape for this kind of ‘transformation’. I will come back to that in the next post.

OK… But I still don’t quite get why this Riemann surfaces are so important. I must assume it has something to do with the mystery of rolled-up dimensions and all that (so that’s string theory), but I guess I’ll be able to shed some more light on that question only once I’ve gotten through that whole chapter on them (and the chapters following that one).  I’ll keep you posted. 🙂

Post scriptum: On page 138 (Fig. 8.3), Penrose shows us how to construct the spiral ramp for the log z function. He insists on doing this by taking overlapping patches of space, such as the L(z) and Log z branch of the log z function, with θ going from 0 to 2π for the L(z) branch) and from -π to +π for the Log z branch (so we have an overlap here from 0 to +π). Indeed, one cannot glue or staple patches together if the patch surfaces don’t overlap to some extent… unless you use sellotape of course. 🙂 However, continuity requires some overlap and, hence, just joining the edges of patches of space with sellotape, instead of gluing overlapping areas together, is not allowed. 🙂

So, constructing a model of that spiral ramp is not an extraordinary intellectual challenge. However, constructing a model of the Riemann surfaces described above (i.e. z1/2, z1/3, z1/4 or, more in general, constructing a Riemann surface for any rational power of z, i.e. any function w = zn/m, is not all that easy: Brown and Churchill, for example, state that is actually ‘physically impossible’ to model that (see Brown and Churchill, Complex Variables and Applications (7th ed.), p. 337).

Huh? But so we just did that for z1/2, z1/3 and z1/4, didn’t we? Well… Look at that plot for w = z1/2 once again. The problem is that the two sheets cut through each other. They have to do that, of course, because, unlike the sheets of the log z function, they have to join back together again, instead of just spiraling endlessly up or down. So we just let these sheets cross each other. However, at that spot (i.e. the line where the sheets cross each other), we would actually need two representations of z. Indeed, as the top sheet cuts through the bottom sheet (so as we’re moving down on that surface), the value of θ will be equal to π, and so that corresponds to a value for w equal to w = z1/2 = √r eiπ/2 (I am looking at the n = 0 case here). However, when the bottom sheet cuts through the top sheet (so if we’re moving up instead of down on that surface), θ’s value will be equal to 3π (because we’ve made three half-turns now, instead of just one) and, hence, that corresponds to a value for w equal to w = z1/2 = √r e3iπ/2, which is obviously different from √r eiπ/2. I could do the same calculation for the n = ±1 case: just add ±π to the argument of w.

Huh? You’ll probably wonder what I am trying to say here. Well, what I am saying here is that plot of the surface gives us the impression that we do not have two separate roots w1 and won the (negative) real axis. But so that’s not the case: we do have two roots there, but we can’t distinguish them with that plot of the surface because we’re only looking at the real part of w.

So what?

Well… I’d say that shouldn’t worry us all that much. When building a model, we just need to be aware that it’s a model only and, hence, we need to be aware of the limitations of what we’re doing. I actually build a paper model of that surface by taking two paper disks: one for the top sheet, and one for the bottom sheet. Then I cut those two disks along the radius and folded and glued both of them like a Chinese hat (yes, like the one the girl below is wearing). And then I took those two little paper Chinese hats, put one of them upside down, and ‘connected’ them (or should I say, ‘stitched’ or ‘welded’ perhaps? :-)) with the other one along the radius where I had cut into these disks. [I could go through the trouble of taking a digital picture of it but it’s better you try it yourself.]

ChineseHat

Wow! I did not expect to be used as an illustration in a blog on math and physics! 🙂

🙂 OK. Let’s get somewhat more serious again. The point to note is that, while these models (both the plot as well as the two paper Chinese hats :-)) look nice enough, Brown and Churchill are right when they note that ‘the points where two of the edges are joined are distinct from the points where the two other edges are joined’. However, I don’t agree with their conclusion in the next phrase, which states that it is ‘thus physically impossible to build a model of that Riemann surface.’ Again, the plot above and my little paper Chinese hats are OK as a model – as long as we’re aware of how we should interpret that line where the sheets cross each other: that line represents two different sets of points.

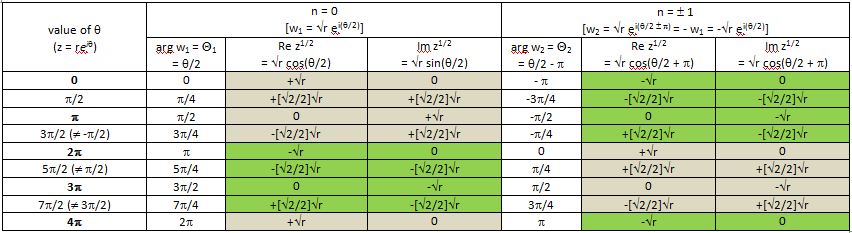
Let me go one step further here (in an attempt to fully exhaust the topic) and insert a table here with the values of both the real and imaginary parts of √z for both roots (i.e. the n = 0 and n = ± 1 case). The table shows what is to be expected: the values for the n = ± 1 case are the same as for n = 0 but with the opposite sign. That reflects the fact that the two roots are each other’s opposite indeed, so when you’re plotting the two square roots of a complex number z = reiθ, you’ll see they are on opposite sides on a circle with radius √r. Indeed, rei(θ/2 + π) = rei(θ/2)eiπ = –rei(θ/2). [If the illustration below is too small to read the print, then just click on it and it should expand.]

values of square root of z

The grey and green colors in the table have the same role as the red, green and yellow colors I used to illustrated how the cube roots of z come back periodically. We have the same thing here indeed: the values we get for the n = 0 case are exactly the same as for the n = ± 1 case but with a difference in ‘phase’ I’d say of one turn around the origin, i.e. a ‘phase’ difference of 2π. In other words, the value of √z in the n = 0 case for θ going from 0 to 2π is equal to the value of √z in the n = ± 1 case but for θ going from 2π to 4π and, vice versa, the value of √z in the n = ±1 case for θ going from 0 to 2π is equal to the value of √z in the n = 0 case for θ going from 2π to 4π. Now what’s the meaning of that? 

It’s quite simple really. The two different values of n mark the different branches of the w function, but branches of functions always overlap of course. Indeed, look at the value of the argument of w, i.e. Θ: for the n = 0 case, we have 0 < Θ < 2π, while for the n = ± 1 case, we have -π < Θ < +π. So we’ve got two different branches here indeed, but they overlap for all values Θ between 0 and π and, for these values, where Θ1 = Θ2, we will obviously get the same value for w, even if we’re looking at two different branches (Θ1 is the argument of w1, and Θ2 is the argument of w2). 

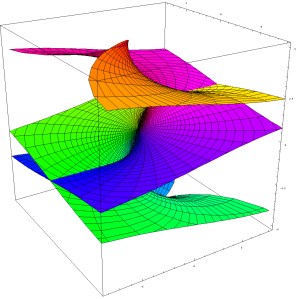
OK. I guess that’s all very self-evident and so I should really stop here. However, let me conclude by noting the following: to understand the ‘fully story’ behind the graph, we should actually plot both the surface of the imaginary part of √z as well as the surface of the real part of of √z, and superimpose both. We’d obviously get something that would much more complicated than the ‘two Chinese hats’ picture. I haven’t learned how to master math software (such as Maple for instance), as yet, and so I’ll just copy a plot which I found on the web: it’s a plot of both the real and imaginary part of the function w = z2. That’s obviously not the same as the w = z1/2 function, because w = z2 is a single-valued function and so we don’t have all these complications. However, the graph is illustrative because it shows how two surfaces – one representing the real part and the other the imaginary part of a function value – cut through each other thereby creating four half-lines (or rays) which join at the origin. 

complex parabola w = z^2

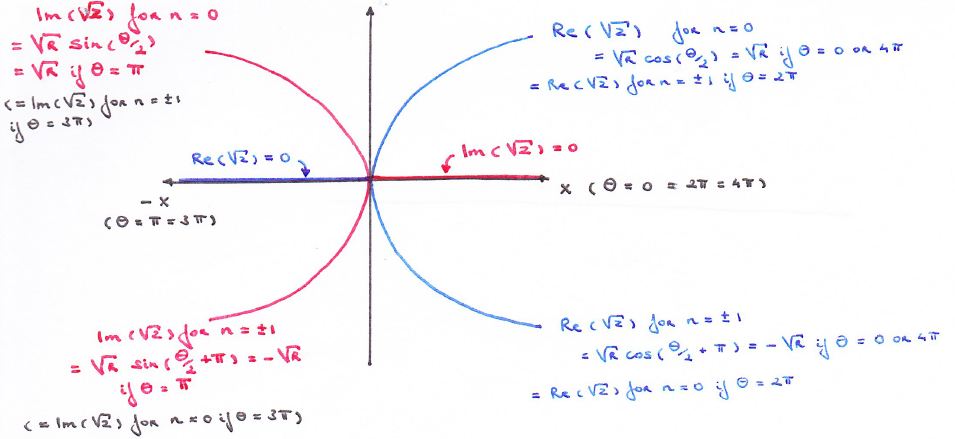
So we could have something similar for the w = z1/2 function if we’d have one surface representing the imaginary part of z1/2 and another representing the  real part of z1/2. The sketch below illustrates the point. It is a cross-section of the Riemann surface along the x-axis (so the imaginary part of z is zero there, as the values of θ are limited to 0, π, 2π, 3π, back to 4π = 0), but with both the real as well as the imaginary part of  z1/2 on it. It is obvious that, for the w = z1/2 function, two of the four half-lines marking where the two surfaces are crossing each other coincide with the positive and negative real axis respectively: indeed, Re( z1/2) = 0 for θ = π and 3π (so that’s the negative real axis), and Im(z1/2) = 0 for θ = 0, 2π and 4π (so that’s the positive real axis).

branch point

The other two half-lines are orthogonal to the real axis. They follow a curved line, starting from the origin, whose orthogonal projection on the z plane coincides with the y axis. The shape of these two curved lines (i.e. the place where the two sheets intersect above and under the axis) is given by the values for the real and imaginary parts of the √z function, i.e. the vertical distance from the y axis is equal to ± (√2√r)/2.

Hmm… I guess that, by now, you’re thinking that this is getting way too complicated. In addition, you’ll say that the representation of the Riemann surface by just one number (i.e. either the real or the imaginary part) makes sense, because we want one point to represent one value of w only, don’t we? So we want one point to represent one point only, and that’s not what we’re getting when plotting both the imaginary as well as the real part of w in a combined graph. Well… Yes and no. Insisting that we shouldn’t forget about the imaginary part of the surface makes sense in light of the next post, in which I’ll say a think or two about ‘compactifying’ surfaces (or spaces) like the one above. But so that’s for the next post only and, yes, you’re right: I should stop here.

Riemann surfaces (I)

Pre-scriptum (dated 26 June 2020): the material in this post remains interesting but is, strictly speaking, not a prerequisite to understand quantum mechanics. It’s yet another example of how one can get lost in math when studying or teaching physics. :-/

Original post:

In my previous post on this blog, I once again mentioned the issue of multiple-valuedness. It is probably time to deal with the issue once and for all by introducing Riemann surfaces.

Penrose attaches a lot of importance to these Riemann surfaces (so I must assume they are very important). In contrast, in their standard textbook on complex analysis, Brown and Churchill note that the two sections on Riemann surfaces are not essential reading, as it’s just ‘a geometric device’ to deal with multiple-valuedness. But so let’s go for it.

I already signaled that complex powers w = zc are multiple-valued functions of z and so that causes all kinds of problems, because we can’t do derivatives and integrals and all that. In fact,  zc = ec log z and so we have two components on the right-hand side of this equation. The first one is the (complex) exponential function ec, i.e. the real number e raised to a complex power c. We already know (see the other posts below) that this is a periodic function with (imaginary) period 2πie= ec+2πi eiec = 1ec. While this periodic component of zc is somewhat special (as compared to exponentiation in real analysis), it is not this periodic component but the log z component which is causing the problem of multiple-valuedness. [Of course, it’s true that the problem of multiple-valuedness of the log function is, in fact, a logical consequence of the periodicity of the complex power function, but so you can figure that out yourself I guess.] So let’s look at that log z function once again.

If we write z in its polar form z = reiθ, then log z will be equal to log z = ln r + i(θ+2nπ) with n = 0, ±1, ±2,… Hence, if we write log z in rectangular coordinates (i.e. log z = x + iy) , then we note that the x component (i.e.the real part) of log z is equal to ln r and, hence, x is just an ordinary real number with some fixed value (x = ln r). However, the y component (i.e. the imaginary part of log z) does not have any fixed value: θ is just one of the values, but so are θ+2π and θ – 2π and θ+4π etcetera. In short, we have an infinite number of values for y, and so that’s the issue: what do we do with all these values? It’s not a proper function anymore.

Now, this problem of multiple-valuedness is usually solved by just picking a so-called principal value for log z, which is written as Log z = ln r + iθ, and which is defined by mathematicians by imposing the condition that θ takes a value in the interval between -π and +π only (hence, -π < θ < π). In short, the mathematicians usually just pretend that the 2nπthing doesn’t matter.

However, this is not trivial: as we are imposing these restrictions on the value of Θ, we are actually defining some new single-valued function Log z = ln r + iθ. This Log z function, then, is a complex-valued analytic function with two real-valued components: x = ln r and y = θ. So, while x = ln r can take any value on the real axis, we let θ range from -π to +π only (in the usual counterclockwise or ‘positive’ direction, because that happens to be the convention). If we do this, we get a principal value for zas well: P.V. zc = ec Log z, and so we’ve ‘solved’ the problem of multiple values for the function ztoo in this way.

What we are doing here has a more general significance: we are taking a so-called branch out of a multiple-valued function, in order to make it single-valued and, hence, analytic. To illustrate what is really going on here, let us go back to the original multiple-valued log z = ln r + i(θ+2nπ) function and let’s do away with this integer n by writing log z in the more general form log z = ln r + iΘ. Of course, Θ is equal to θ+2nπ but so we’ll just forget about the θ and, most importantly, about the n, and allow the y component (i.e. the imaginary part) of the imaginary number log z = x + iy to take on any value Θ in the real field. In other words, we treat this angle Θ just like any other ordinary real number. We can now define branches of log z again, but in a more general way: we can pick any value α and say that’s a branch point, as it will define a range α <  Θ < α + 2π in which, once again, we limit the possible values of log z to just one.

For example, if we choose α = -π, then Θ will range from -π to +π and so then we’re back to log z’s principal branch, i.e. Log z. However, let us now, instead of taking this Log z branch, define another branch – we’ll call it the L(z) branch – by choosing α = 0 and, hence, letting Θ range from 0 to 2π. So we have 0 < Θ < 2π and, of course, you’ll note that this range overlaps with the range that is being used for the principal branch of log z (i.e. Log z). It does, and it’s not a problem. Indeed, for values 0 < Θ < π (i.e. the overlapping half-plane) we get the same set of values Log z = L(z) for log z, and so we are talking the same function indeed.

OK. I guess we understand that. So what? Well… The fact is that we have found a very very nice way of illustrating the multiple-valuedness of the log z function and – more importantly – a nice way of ‘solving’ it too. Have a look at the beautiful 3D graph below. It represents the log z function. [Well… Let me be correct and note that, strictly speaking, this particular surface seems to represent the imaginary part of the log z function only, but that’s OK at this stage.]

Riemann_surface_log

Huh? What’s happening here? Well, this spiral surface represents the log z function by ‘gluing’ successive log z branches together. I took the illustration from Wikipedia’s article on the complex logarithm and, to explain how this surface has been constructed, let’s start at the origin, which is located right in the center of this graph, between the yellow-green and the red-pinkish sheets (so the horizontal (x, y) plane we start from is not the bottom of this rectangular prism: you should imagine it at its center).

From there, we start building up the first ‘level’ of this graph (i.e. the yellowish level above the origin) as the angle Θ sweeps around the origin,  in counterclockwise direction, across the upper half of the complex z plane. So it goes from 0 to π and, when Θ crosses the negative side of the real axis, it has added π to its original value. With ‘original value’, I mean its value when it crossed the positive real axis the previous time. As we’ve just started, Θ was equal to 0. We then go from π to 2π, across the lower half of the complex plane, back to the positive real axis: that gives us the first ‘level’ of this spiral staircase (so the vertical distance reflects the value of Θ indeed, which is the imaginary part of log z) . Then we can go around the origin once more, and so Θ goes from 2π to 4π, and so that’s how we get the second ‘level’ above the origin – i.e. the greenish one. But – hey! – how does that work? The angle 2π is the same as zero, isn’t it? And 4π as well, no?Well… No. Not here. It is the same angle in the complex plane, but is not the same ‘angle’ if we’re using it here in this log z = ln r + iΘ function.

Let’s look at the first two levels (so the yellow-green ones) of this 3D graph once again. Let’s start with Θ = 0 and keep Θ fixed at this zero value for a while. The value of log z is then just the real component of this log z = ln r + iΘ function, and so we have log z = ln r + i0 = ln r. This ln r function (or ln(x) as it is written below) is just the (real) logarithmic function, which has the familiar form shown below. I guess there is no need to elaborate on that although I should, perhaps, remind you that r (or x in the graph below) is always some positive real number, as it’s the modulus of a vector – or a vector length if that’s easier to understand. So, while ln(r) can take on any (real-number) value between -∞ and +∞, the argument r is always a positive real number.

375px-Logarithm_derivative

Let us now look at what happens with this log z function as Θ moves from 0 to 2π, first through the upper half of the complex z plane, to Θ = π first, and then further to 2π through the lower half of the complex plane. That’s less easy to visualize, but the illustration below might help. The circles in the plane below (which is the z plane) represent the real part of log z: the parametric representation of these circles is: Re(log z) = ln r = constant. In short, when we’re on these circles, going around the origin, we keep r fixed in the z plane (and, hence, ln r is constant indeed) but we let the argument of z (i.e. Θ) vary from 0 to 2π and, hence, the imaginary part of log z (which is equal to Θ)  will also vary. On the rays it is the other way around: we let r vary but we keep the argument Θ of the complex number z = reiθ fixed. Hence, each ray is the parametric representation of Im(log z) = Θ = constant, so Θ is some fixed angle in the interval 0 < π < 2π.

Logez02

Let’s now go back to that spiral surface and construct the first level of that surface (or the first ‘sheet’ as it’s often referred to) once again. In fact, there is actually more than way to construct such spiral surface: while the spiral ramp above seems to depict the imaginary part of log z only, the vertical distance on the illustration below includes both the real as well as the imaginary part of log z (i.e. Re log z + Im log z = ln r + Θ).

Final graph of log z

Again, we start at the origin, which is, again, the center of this graph (there is a zero (0) marker nearby, but that’s actually just the value of Θ on that ray (Θ = 0), not a marker for the origin point). If we move outwards from the center, i.e. from the origin, on the horizontal two-dimensional z = x + iy = (x,y) plane but along the ray Θ = 0, then we again have log z = ln r + i0 = ln r. So, looking from above, we would see an image resembling the illustration above: we move on a circle around the origin if we keep r constant, and we move on rays if we keep Θ constant. So, in this case, we fix the value of Θ at 0 and move out on a ray indeed and, in three dimensions, the shape of that ray reflects the ln r function. As we then become somewhat more adventurous and start moving around the origin, rather than just moving away from it, the iΘ term in this ln r + iΘ function kicks in and the imaginary part of w (i.e. Im(log z) = y = Θ) grows. To be precise, the value 2π gets added to y with every loop around the origin as we go around it. You can actually ‘measure’ this distance 2π ≈ 6.3 between the various ‘sheets’ on the spiral surface along the vertical coordinate axis (that is if you could read the tiny little figures along the vertical coordinate axis in these 3D graphs, which you probably can’t).

So, by now you should get what’s going on here. We’re looking at this spiral surface and combining both movements now. If we move outwards, away from this center, keeping Θ constant, we can see that the shape of this spiral surface reflects the shape of the ln r function, going to -∞ as we are close to the center of the spiral, and taking on more moderate (positive) values further away from it. So if we move outwards from the center, we get higher up on this surface. We can also see that we also move higher up this surface as we move (counterclockwise) around the origin, rather than away from it. Indeed, as mentioned above, the vertical coordinate in the graph above (i.e. the measurements along the vertical axis of the spiral surface) is equal to the sum of Re(log) and Im(log z). In other words, the ‘z’ coordinate in the Euclidean three-dimensional (x, y, z) space which the illustrations above are using is equal to ln r + Θ, and, hence, as 2π gets added to the previous value of Θ with every turn we’re making around the origin, we get to the next ‘level’ of the spiral, which is exactly 2π higher than the previous level. Vice versa, 2π gets subtracted from the previous value of Θ as we’re going down the spiral, i.e. as we are moving clockwise (or in the ‘negative’ direction as it is aptly termed).

OK. This has been a very lengthy explanation but so I just wanted to make sure you got it. The horizontal plane is the z plane, so that’s all the points z = x + iy = reiθ, and so that’s the domain of the log z function. And then we have the image of all these points z under the log z function, i.e. the points w = ln r + iΘ right above or right below the z points on the horizontal plane through the origin.

Fine. But so how does this ‘solve’ the problem of multiple-valuedness, apart from ‘illustrating’ it? Well… From the title of this post, you’ll have inferred – and rightly so – that the spiral surface which we have just constructed is one of these so-called Riemann surfaces.

We may look at this Riemann surface as just another complex surface because, just like the complex plane, it is a two-dimensional manifold. Indeed, even if we have represented it in 3D, it is not all that different from a sphere as a non-Euclidean two-dimensional surface: we only need two real numbers (r and Θ) to identify any point on this surface and so it’s two-dimensional only indeed (although it has more ‘structure’ than the ‘flat’ complex plane we are used to) . It may help to note that there are other surfaces like this, such as the ones below, which are Riemann surfaces for other multiple-valued functions: in this case, the surfaces below are Riemann surfaces for the (complex) square root function (f(z) = z1/2) and the (complex) arcsin(z) function.

Riemann_surface_sqrtRiemann_surface_arcsin

Nice graphs, you’ll say but, again, what is this all about? These graphs surely illustrate the problem of multiple-valuedness but so how do they help to solve it? Well… The trick is to use such Riemann surface as a domain really: now that we’ve got this Riemann surface, we can actually use it as a domain and then log z (or z1/2 or arcsin(z) if we use these other Riemann surfaces) will be a nice single-valued (and analytic) function for all points on that surface. 

Huh? What? […] Hmm… I agree that it looks fishy: we first use the function itself to construct a ‘Riemannian’ surface, and then we use that very same surface as a ‘Riemannian’ domain for the function itself? Well… Yes. As Penrose puts it: “Complex (analytic) functions have a mind of their own, and decide themselves what their domain should be, irrespective of the region of the complex plane which we ourselves may initially have allotted to it. While we may regard the function’s domain to be represented by the Riemann surface associated with the function, the domain is not given ahead of time: it is the explicit form of the function itself that tells us which Riemann surface the domain actually is.”

I guess we’ll have to judge the value of this bright Riemannian idea (Bernhardt Riemann had many bright ideas during his short lifetime it seems) when we understand somewhat better why we’d need these surfaces for solving physics problems. Back to Penrose. 🙂

Post scriptum: Brown and Churchill seem to approach the matter of how to construct a Riemann surface somewhat less rigorously than I do, as they do not provide any 3D illustrations but just talk about joining thin sheets, by cutting them along the positive half of the real axis and then joining the lower edge of the slit of the first sheet to the upper edge of the slit in the second sheet. This should be done, obviously, by making sure there is no (additional) tearing of the original sheet surfaces and all that (so we’re talking ‘continuous deformations’ I guess), but so that could be done, perhaps, without creating that ‘tornado vortex’ around the vertical axis, which you can clearly see in that gray 3D graph above. If we don’t include the ln r term in the definition of the ‘z’ coordinate in the Euclidean three-dimensional (x, y, z) space which the illustrations above are using, then we’d have a spiral ramp without a ‘hole’ in the center. However, that being said, in order to construct a ‘proper’ two-dimensional manifold, we would probably need some kind function of r in the definition of ‘z’. In fact, we would probably need to write r as some function of Θ in order to make sure we’ve got a proper analytic mapping. I won’t go into detail here (because I don’t know the detail) but leave it to you to check it out on the Web: just check on various parametric representations of spiral ramps: there’s usually (and probably always) a connection between Θ and how, and also how steep, spiral ramps climb around their vertical axis.