
Pre-scriptum (dated 26 June 2020): This post suffered from the attack by the dark force. In any case, my views on the true nature of the concept of uncertainty in physics have evolved as part of my explorations of a more realist (classical) explanation of quantum mechanics. If you are reading this, then you are probably looking for not-to-difficult reading. In that case, I would suggest you read my re-write of Feynman’s introductory lecture to QM. If you want something shorter, you can also read my paper on what I believe to be the true Principles of Physics.
Original post:
Let me, just like Feynman did in his last lecture on quantum electrodynamics for Alix Mautner, discuss some loose ends. Unlike Feynman, I will not be able to tie them up. However, just describing them might be interesting and perhaps you, my imaginary reader, could actually help me with tying them up ! Let’s first re-visit the wave function for a photon by way of introduction.
The wave function for a photon
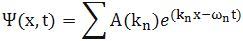
Let’s not complicate things from the start and, hence, let’s first analyze a nice Gaussian wave packet, such as the right-hand graph below: Ψ(x, t). It could be a de Broglie wave representing an electron but here we’ll assume the wave packet might actually represent a photon. [Of course, do remember we should actually show both the real as well as the imaginary part of this complex-valued wave function but we don’t want to clutter the illustration and so it’s only one of the two (cosine or sine). The ‘other’ part (sine or cosine) is just the same but with a phase shift. Indeed, remember that a complex number reθ is equal to r(cosθ + isinθ), and the shape of the sine function is the same as the cosine function but it’s shifted to the left with π/2. So if we have one, we have the other. End of digression.]

The assumptions associated with this wonderful mathematical shape include the idea that the wave packet is a composite wave consisting of a large number of harmonic waves with wave numbers k1, k2, k3,… all lying around some mean value μk. That is what is shown in the left-hand graph. The mean value is actually noted as k-bar in the illustration above but because I can’t find a k-bar symbol among the ‘special characters’ in the text editor tool bar here, I’ll use the statistical symbols μ and σ to represent a mean value (μ) and some spread around it (σ). In any case, we have a pretty normal shape here, resembling the Gaussian distribution illustrated below.
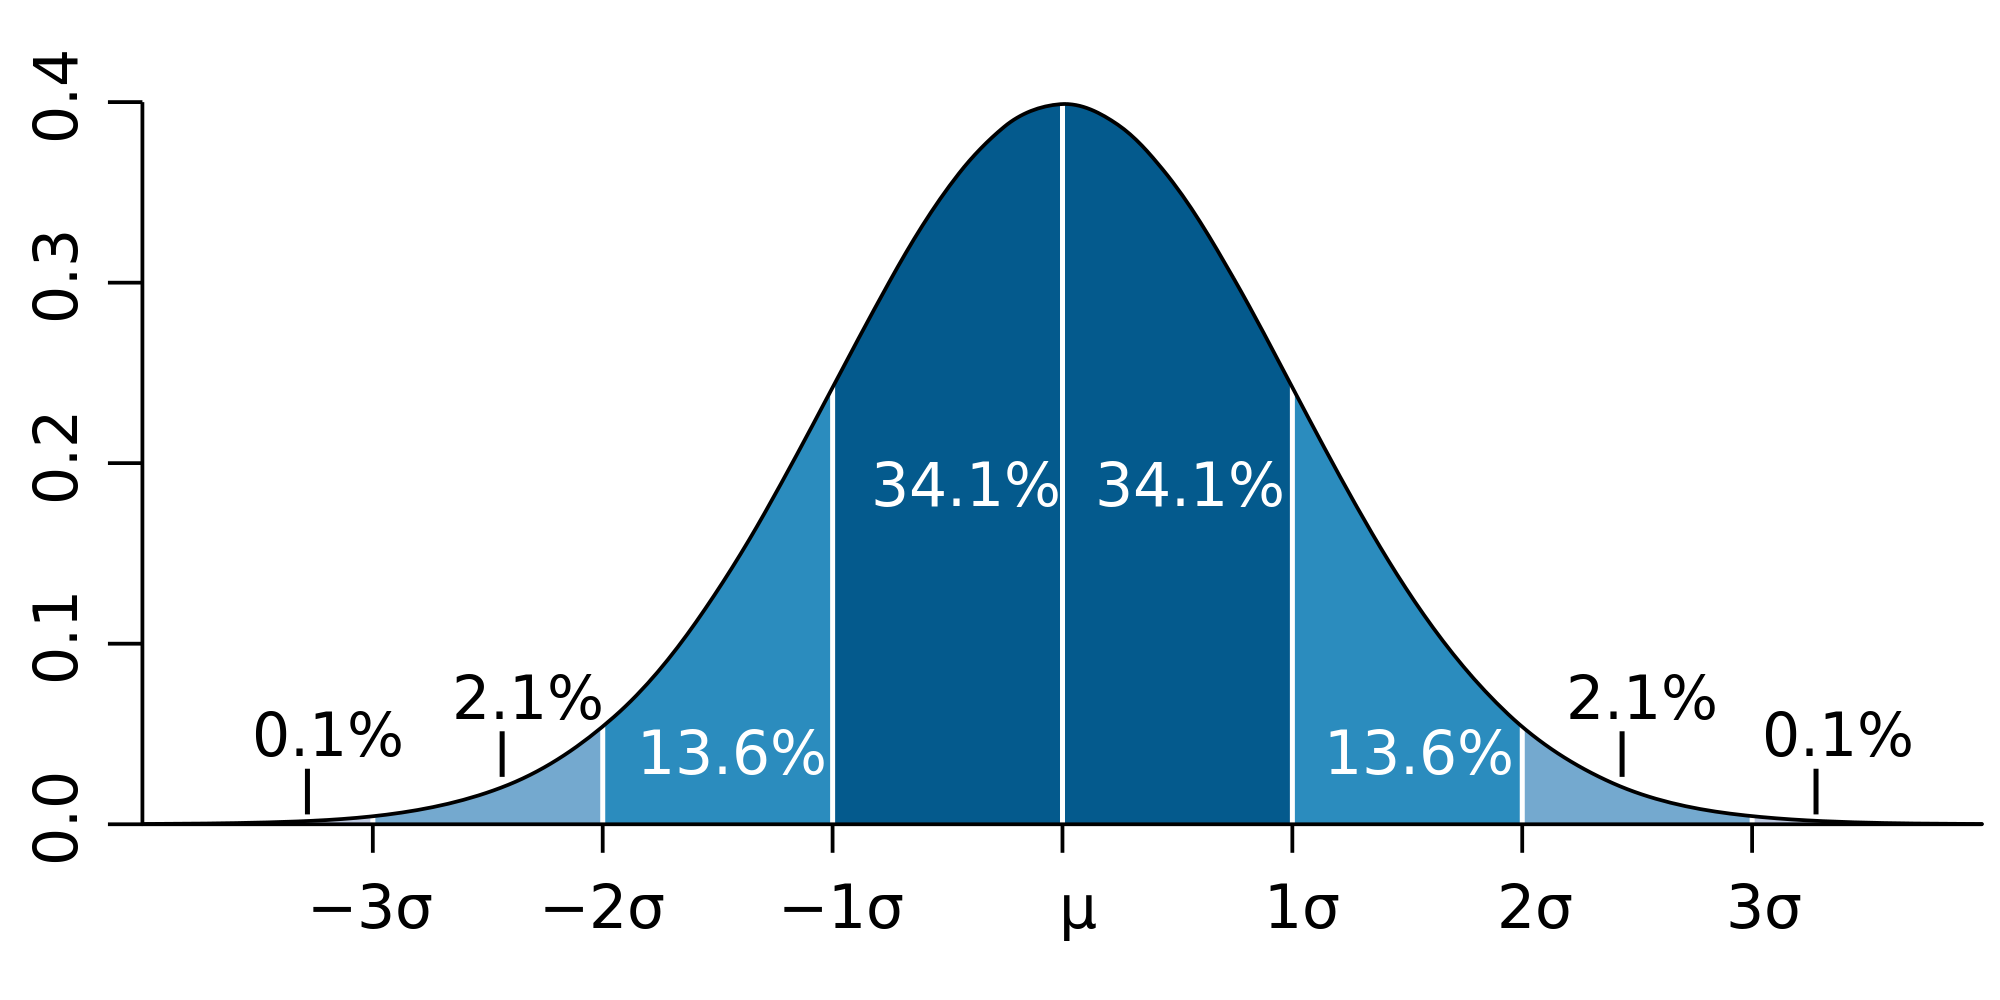 These Gaussian distributions (also known as a density function) have outliers, but you will catch 95,4% of the observations within the μ ± 2σ interval, and 99.7% within the μ ± 3σ interval (that’s the so-called two- and three-sigma rule). Now, the shape of the left-hand graph of the first illustration, mapping the relation between k and A(k), is the same as this Gaussian density function, and if you would take a little ruler and measure the spread of k on the horizontal axis, you would find that the values for k are effectively spread over an interval that’s somewhat bigger than k-bar plus or minus 2Δk. So let’s say 95,4% of the values of k lie in the interval [μk – 2Δk, μk + 2Δk]. Hence, for all practical purposes, we can write that μk – 2Δk < kn < μk + 2Δk. In any case, we do not care too much about the rest because their contribution to the amplitude of the wave packet is minimal anyway, as we can see from that graph. Indeed, note that the A(k) values on the vertical axis of that graph do not represent the density of the k variable: there is only one wave number for each component wave, and so there’s no distribution or density function of k. These A(k) numbers represent the (maximum) amplitude of the component waves of our wave packet Ψ(x, t). In short, they are the values A(k) appearing in the summation formula for our composite wave, i.e. the wave packet:
I don’t want to dwell much more on the math here (I’ve done that in my other posts already): I just want you to get a general understanding of that ‘ideal’ wave packet possibly representing a photon above so you can follow the rest of my story. So we have a (theoretical) bunch of (component) waves with different wave numbers kn, and the spread in these wave numbers – i.e. 2Δk, or let’s take 4Δk to make sure we catch (almost) all of them – determines the length of the wave packet Ψ, which is written here as 2Δx, or 4Δx if we’d want to include (most of) the tail ends as well. What else can we say about Ψ? Well… Maybe something about velocities and all that? OK.
To calculate velocities, we need both ω and k. Indeed, the phase velocity of a wave (vp) is equal to vp = ω/k. Now, the wave number k of the wave packet itself – i.e. the wave number of the oscillating ‘carrier wave’ so to say – should be equal to μk according to the article I took this illustration from. I should check that but, looking at that relationship between A(k) and k, I would not be surprised if the math behind is right. So we have the k for the wave packet itself (as opposed to the k’s of its components). However, I also need the angular frequency ω.
So what is that ω? Well… That will depend on all the ω’s associated with all the k’s, isn’t it? It does. But, as I explained in a previous post, the component waves do not necessarily have to travel all at the same speed and so the relationship between ω and k may not be simple. We would love that, of course, but Nature does what it wants. The only reasonable constraint we can impose on all those ω’s is that they should be some linear function of k. Indeed, if we do not want our wave packet to dissipate (or disperse or, to put it even more plainly, to disappear), then the so-called dispersion relation ω = ω(k) should be linear, so ωn should be equal to ωn = akn + b. What a and b? We don’t know. Random constants. But if the relationship is not linear, then the wave packet will disperse and it cannot possibly represent a particle – be it an electron or a photon.
I won’t go through the math all over again but in my Re-visiting the Matter Wave (I), I used the other de Broglie relationship (E = ħω) to show that – for matter waves that do not disperse – we will find that the phase velocity will equal c/β, with β = v/c, i.e. the ratio of the speed of our particle (v) and the speed of light (c). But, of course, photons travel at the speed of light and, therefore, everything becomes very simple and the phase velocity of the wave packet of our photon would equal the group velocity. In short, we have:
vp = ω/k = vg = ∂ω/∂k = c
Of course, I should add that the angular frequency of all component waves will also be equal to ω = ck, so all component waves of the wave packet representing a photon are supposed to travel at the speed of light! What an amazingly simple result!
It is. In order to illustrate what we have here – especially the elegance and simplicity of that wave packet for a photon – I’ve uploaded two gif files (see below). The first one could represent our ‘ideal’ photon: group and phase velocity (represented by the speed of the green and red dot respectively) are the same. Of course, our ‘ideal’ photon would only be one wave packet – not a bunch of them like here – but then you may want to think that the ‘beam’ below might represent a number of photons following each other in a regular procession.

The second animated gif below shows how phase and group velocity can differ. So that would be a (bunch of) wave packets representing a particle not traveling at the speed of light. The phase velocity here is faster than the group velocity (the red dot travels faster than the green dot). [One can actually also have a wave with positive group velocity and negative phase velocity – quite interesting ! – but so that would not represent a particle wave.] Again, a particle would be represented by one wave packet only (so that’s the space between two green dots only) but, again, you may want to think of this as representing electrons following each other in a very regular procession.
 These illustrations (which I took, once again, from the online encyclopedia Wikipedia) are a wonderful pedagogic tool. I don’t know if it’s by coincidence but the group velocity of the second wave is actually somewhat slower than the first – so the photon versus electron comparison holds (electrons are supposed to move (much) slower). However, as for the phase velocities, they are the same for both waves and that would not reflect the results we found for matter waves. Indeed, you may or may not remember that we calculated superluminal speeds for the phase velocity of matter waves in that post I mentioned above (Re-visiting the Matter Wave): an electron traveling at a speed of 0.01c (1% of the speed of light) would be represented by a wave packet with a group velocity of 0.01c indeed, but its phase velocity would be 100 times the speed of light, i.e. 100c. [That being said, the second illustration may be interpreted as a little bit correct as the red dot does travel faster than the green dot, which – as I explained – is not necessarily always the case when looking at such composite waves (we can have slower or even negative speeds).]
Of course, I should once again repeat that we should not think that a photon or an electron is actually wriggling through space like this: the oscillation only represent the real or imaginary part of the complex-valued probability amplitude associated with our ‘ideal’ photon or our ‘ideal’ electron. That’s all. So this wave is an ‘oscillating complex number’, so to say, whose modulus we have to square to get the probability to actually find the photon (or electron) at some point x and some time t. However, the photon (or the electron) itself are just moving straight from left to right, with a speed matching the group velocity of their wave function.
Are they?
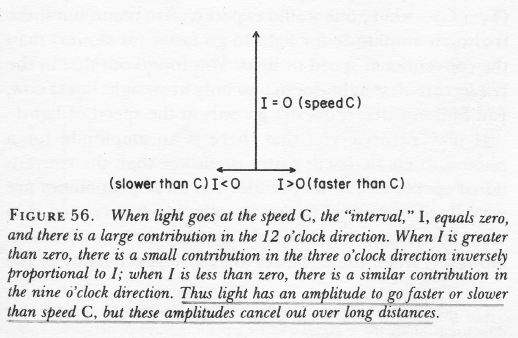
Well… No. Or, to be more precise: maybe. WHAT? Yes, that’s surely one ‘loose end’ worth mentioning! According to QED, photons also have an amplitude to travel faster or slower than light, and they are not necessarily moving in a straight line either. WHAT? Yes. That’s the complicated business I discussed in my previous post. As for the amplitudes to travel faster or slower than light, Feynman dealt with them very summarily. Indeed, you’ll remember the illustration below, which shows that the contributions of the amplitudes associated with slower or faster speed than light tend to nil because (a) their magnitude (or modulus) is smaller and (b) they point in the ‘wrong’ direction, i.e. not the direction of travel.
Still, these amplitudes are there and – Shock, horror ! – photons also have an amplitude to not travel in a straight line, especially when they are forced to travel through a narrow slit, or right next to some obstacle. That’s diffraction, described as “the apparent bending of waves around small obstacles and the spreading out of waves past small openings” in Wikipedia.
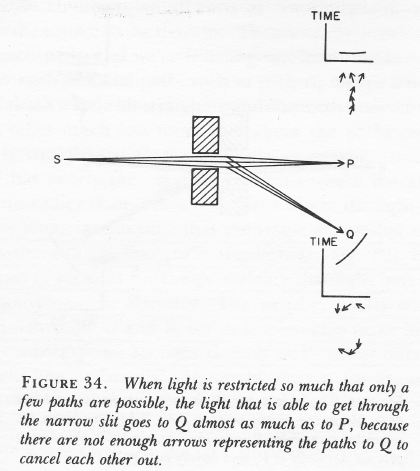
Diffraction is one of the many phenomena that Feynman deals with in his 1985 Alix G. Mautner Memorial Lectures. His explanation is easy: “not enough arrows” – read: not enough amplitudes to add. With few arrows, there are also few that cancel out indeed, and so the final arrow for the event is quite random, as shown in the illustrations below.

So… Not enough arrows… Feynman adds the following on this: “[For short distances] The nearby, nearly straight paths also make important contributions. So light doesn’t really travel only in a straight line; it “smells” the neighboring paths around it, and uses a small core of nearby space. In the same way, a mirror has to have enough size to reflect normally; if the mirror is too small for the core of neighboring paths, the light scatters in many directions, no matter where you put the mirror.” (QED, 1985, p. 54-56)
Not enough arrows… What does he mean by that? Not enough photons? No. Diffraction for photons works just the same as for electrons: even if the photons would go through the slit one by one, we would have diffraction (see my Revisiting the Matter Wave (II) post for a detailed discussion of the experiment). So even one photon is likely to take some random direction left or right after going through a slit, rather than to go straight. Not enough arrows means not enough amplitudes. But what amplitudes is he talking about?
These amplitudes have nothing to do with the wave function of our ideal photon we were discussing above: that’s the amplitude Ψ(x, t) of a photon to be at point x at point t. The amplitude Feynman is talking about is the amplitude of a photon to go from point A to B along one of the infinitely many possible paths it could take. As I explained in my previous post, we have to add all of these amplitudes to arrive at one big final arrow which, over longer distances, will usually be associated with a rather large probability that the photon will travel in a straight line and at the speed of light – which is why light seems to do at a macro-scale. 🙂
But back to that very succinct statement: not enough arrows. That’s obviously a very relative statement. Not enough as compared to what? What measurement scale are we talking about here? It’s obvious that the ‘scale’ of these arrows for electrons is different than for photons, because the 2012 diffraction experiment with electrons that I referred to used 50 nanometer slits (50×10−9 m), while one of the many experiments demonstrating light diffraction using pretty standard (red) laser light used slits of some 100 micrometer (that 100×10−6 m or – in units you are used to – 0.1 millimeter).
The key to the ‘scale’ here is the wavelength of these de Broglie waves: the slit needs to be ‘small enough’ as compared to these de Broglie wavelengths. For example, the width of the slit in the laser experiment corresponded to (roughly) 100 times the wavelength of the laser light, and the (de Broglie) wavelength of the electrons in that 2012 diffraction experiment was 50 picometer – that was actually a thousand times the electron wavelength – but it was OK enough to demonstrate diffraction. Much larger slits would not have done the trick. So, when it comes to light, we have diffraction at scales that do not involve nanotechnology, but when it comes to matter particles, we’re not talking micro but nano: that’s thousand times smaller.
The weird relation between energy and size
Let’s re-visit the Uncertainty Principle, even if Feynman says we don’t need that (we just need to do the amplitude math and we have it all). We wrote the uncertainty principle using the more scientific Kennard formulation: σxσp ≥ ħ/2, in which the sigma symbol represents the standard deviation of position x and momentum p respectively. Now that’s confusing, you’ll say, because we were talking wave numbers, not momentum in the introduction above. Well… The wave number k of a de Broglie wave is, of course, related to the momentum p of the particle we’re looking at: p = ħk. Hence, a spread in the wave numbers amounts to a spread in the momentum really and, as I wanted to talk scales, let’s now check the dimensions.
The value for ħ is about 1×10–34 Joule·seconds (J·s) (it’s about 1.054571726(47)×10−34 but let’s go with the gross approximation as for now). One J·s is the same as one kg·m2/s because 1 Joule is a shorthand for km kg·m2/s2. It’s a rather large unit and you probably know that physicists prefer electronVolt·seconds (eV·s) because of that. However, even in expressed in eV·s the value for ħ comes out astronomically small: 6.58211928(15)×10−16 eV·s. In any case, because the J·s makes dimensions come out right, I’ll stick to it for a while. What does this incredible small factor of proportionality, both in the de Broglie relations as well in that Kennard formulation of the uncertainty principle, imply? How does it work out from a math point of view?
Well… It’s literally a quantum of measurement: even if Feynman says the uncertainty principle should just be seen “in its historical context”, and that “we don’t need it for adding arrows”, it is a consequence of the (related) position-space and momentum-space wave functions for a particle. In case you would doubt that, check it on Wikipedia: the author of the article on the uncertainty principle derives it from these two wave functions, which form a so-called Fourier transform pair. But so what does it say really?
Look at it. First, it says that we cannot know any of the two values exactly (exactly means 100%) because then we have a zero standard deviation for one or the other variable, and then the inequality makes no sense anymore: zero is obviously not greater or equal to 0.527286×10⁻³⁴ J·s. However, the inequality with the value for ħ plugged in shows how close to zero we can get with our measurements. Let’s check it out.
Let’s use the assumption that two times the standard deviation (written as 2Δk or 2Δx on or above the two graphs in the very first illustration of this post) sort of captures the whole ‘range’ of the variable. It’s not a bad assumption: indeed, if Nature would follow normal distributions – and in our macro-world, that seems to be the case – then we’d capture 95.4 of them, so that’s good. Then we can re-write the uncertainty principle as:
Δx·σp ≥ ħ or σx·Δp ≥ ħ
So that means we know x within some interval (or ‘range’ if you prefer that term) Δx or, else, we know p within some interval (or ‘range’ if you prefer that term) Δp. But we want to know both within some range, you’ll say. Of course. In that case, the uncertainty principle can be written as:
Δx·Δp ≥ 2ħ
Huh? Why the factor 2? Well… Each of the two Δ ranges corresponds to 2σ (hence, σx = Δx/2 and σp = Δp/2), and so we have (1/2)Δx·(1/2)Δp ≥ ħ/2. Note that if we would equate our Δ with 3σ to get 97.7% of the values, instead of 95.4% only, once again assuming that Nature distributes all relevant properties normally (not sure – especially in this case, because we are talking discrete quanta of action here – so Nature may want to cut off the ‘tail ends’!), then we’d get Δx·Δp ≥ 4.5×ħ: the cost of extra precision soars! Also note that, if we would equate Δ with σ (the one-sigma rule corresponds to 68.3% of a normally distributed range of values), then we get yet another ‘version’ of the uncertainty principle: Δx·Δp ≥ ħ/2. Pick and choose! And if we want to be purists, we should note that ħ is used when we express things in radians (such as the angular frequency for example: E = ħω), so we should actually use h when we are talking distance and (linear) momentum. The equation above then becomes Δx·Δp ≥ h/π.
It doesn’t matter all that much. The point to note is that, if we express x and p in regular distance and momentum units (m and kg·m/s), then the unit for ħ (or h) is 1×10–34. Now, we can sort of choose how to spread the uncertainty over x and p. If we spread it evenly, then we’ll measure both Δx and Δp in units of 1×10–17 m and 1×10–17 kg·m/s. That’s small… but not that small. In fact, it is (more or less) imaginably small I’d say.
For example, a photon of a blue-violet light (let’s say a wavelength of around 660 nanometer) would have a momentum p = h/λ equal to some 1×10–22 kg·m/s (just work it out using the values for h and λ). You would usually see this value measured in a unit that’s more appropriate to the atomic scale: 6.25 eV/c. [Converting momentum into energy using E = pc, and using the Joule-electronvolt conversion (1 eV ≈ 1.6×10⁻¹⁹ J) will get you there.] Hence, units of 1×10–17 m for momentum are a hundred thousand times the rather average momentum of our light photon. We can’t have that so let’s reduce the uncertainty related to the momentum to that 1×10–22 kg·m/s scale. Then the uncertainty about position will be measured in units of 1×10–12 m. That’s the picometer scale in-between the nanometer (1×10⁻⁹ m) and the femtometer (1×10⁻⁹ m) scale. You’ll remember that this scale corresponds to the resolution of a (modern) electron microscope (50 pm). So can we see “uncertainty effects” ? Yes. I’ll come back to that.
However, before I discuss these, I need to make a little digression. Despite the sub-title I am using above, the uncertainties in distance and momentum we are discussing here are nowhere near to what is referred to as the Planck scale in physics: the Planck scale is at the other side of that Great Desert I mentioned: the Large Hadron Collider, which smashes particles with (average) energies of 4 tera-electronvolt (i.e. 4 trillion eV – all packed into one particle !) is probing stuff measuring at a scale of a thousandth of a femtometer (0.001×10⁻¹² m), but we’re obviously at the limits of what’s technically possible, and so that’s where the Great Desert starts. The ‘other side’ of that Great Desert is the Planck scale: 10–35 m. Now, why is that some kind of theoretical limit? Why can’t we just continue to further cut these scales down? Just like Dedekind did when defining irrational numbers? We can surely get infinitely close to zero, can we? Well… No. The reasoning is quite complex (and I am not sure if I actually understand it – the way I should) but it is quite relevant to the topic here (the relation between energy and size), and it goes something like this:
- In quantum mechanics, particles are considered to be point-like but they do take space, as evidenced from our discussion on slit widths: light will show diffraction at the micro-scale (10–6 m) but electrons will do that only at the nano-scale (10–9 m), so that’s a thousand times smaller. That’s related to their respective the de Broglie wavelength which, for electrons, is also a thousand times smaller than that of electrons. Now, the de Broglie wavelength is related to the energy and/or the momentum of these particles: E = hf and p = h/λ.
- Higher energies correspond to smaller de Broglie wavelengths and, hence, are associated with particles of smaller size. To continue the example, the energy formula to be used in the E = hf relation for an electron – or any particle with rest mass – is the (relativistic) mass-energy equivalence relation: E = γm0c2, with γ the Lorentz factor, which depends on the velocity v of the particle. For example, electrons moving at more or less normal speeds (like in the 2012 experiment, or those used in an electron microscope) have typical energy levels of some 600 eV, and don’t think that’s a lot: the electrons from that cathode ray tube in the back of an old-fashioned TV which lighted up the screen so you could watch it, had energies in the 20,000 eV range. So, for electrons, we are talking energy levels a thousand or a hundred thousand higher than for your typical 2 to 10 eV photon.
- Of course, I am not talking X or gamma rays here: hard X rays also have energies of 10 to 100 kilo-electronvolt, and gamma ray energies range from 1 million to 10 million eV (1-10 MeV). In any case, the point to note is ‘small’ particles must have high energies, and I am not only talking massless particles such as photons. Indeed, in my post End of the Road to Reality?, I discussed the scale of a proton and the scale of quarks: 1.7 and 0.7 femtometer respectively, which is smaller than the so-called classical electron radius. So we have (much) heavier particles here that are smaller? Indeed, the rest mass of the u and d quarks that make up a proton (uud) is 2.4 and 4.8 MeV/c2 respectively, while the (theoretical) rest mass of an electron is 0.511 Mev/c2 only, so that’s almost 20 times more: (2.4+2.4+4.8/0.5). Well… No. The rest mass of a proton is actually 1835 times the rest mass of an electron: the difference between the added rest masses of the quarks that make it up and the rest mass of the proton itself (938 MeV//c2) is the equivalent mass of the strong force that keeps the quarks together.
- But let me not complicate things. Just note that there seems to be a strange relationship between the energy and the size of a particle: high-energy particles are supposed to be smaller, and vice versa: smaller particles are associated with higher energy levels. If we accept this as some kind of ‘factual reality’, then we may understand what the Planck scale is all about: : the energy levels associated with theoretical ‘particles’ of the above-mentioned Planck scale (i.e. particles with a size in the 10–35 m range) would have energy levels in the 1019 GeV range. So what? Well… This amount of energy corresponds to an equivalent mass density of a black hole. So any ‘particle’ we’d associate with the Planck length would not make sense as a physical entity: it’s the scale where gravity takes over – everything.
Again: so what? Well… I don’t know. It’s just that this is entirely new territory, and it’s also not the topic of my post here. So let me just quote Wikipedia on this and then move on: “The fundamental limit for a photon’s energy is the Planck energy [that’s the 1019 GeV which I mentioned above: to be precise, that ‘limit energy’ is said to be 1.22 × 10¹⁹ GeV], for the reasons cited above [that ‘photon’ would not be ‘photon’ but a black hole, sucking up everything around it]. This makes the Planck scale a fascinating realm for speculation by theoretical physicists from various schools of thought. Is the Planck scale domain a seething mass of virtual black holes? Is it a fabric of unimaginably fine loops or a spin foam network? Is it interpenetrated by innumerable Calabi-Yau manifolds which connect our 3-dimensional universe with a higher-dimensional space? [That’s what’s string theory is about.] Perhaps our 3-D universe is ‘sitting’ on a ‘brane’ which separates it from a 2, 5, or 10-dimensional universe and this accounts for the apparent ‘weakness’ of gravity in ours. These approaches, among several others, are being considered to gain insight into Planck scale dynamics. This would allow physicists to create a unified description of all the fundamental forces. [That’s what’s these Grand Unification Theories (GUTs) are about.]
Hmm… I wish I could find some easy explanation of why higher energy means smaller size. I do note there’s an easy relationship between energy and momentum for massless particles traveling at the velocity of light (like photons): E = pc (or p = E/c), but – from what I write above – it is obvious that it’s the spread in momentum (and, therefore, in wave numbers) which determines how short or how long our wave train is, not the energy level as such. I guess I’ll just have to do some more research here and, hopefully, get back to you when I understand things better.
Re-visiting the Uncertainty Principle
You will probably have read countless accounts of the double-slit experiment, and so you will probably remember that these thought or actual experiments also try to watch the electrons as they pass the slits – with disastrous results: the interference pattern disappears. I copy Feynman’s own drawing from his 1965 Lecture on Quantum Behavior below: a light source is placed behind the ‘wall’, right between the two slits. Now, light (i.e. photons) gets scattered when it hits electrons and so now we should ‘see’ through which slit the electron is coming. Indeed, remember that we sent them through these slits one by one, and we still had interference – suggesting the ‘electron wave’ somehow goes through both slits at the same time, which can’t be true – because an electron is a particle.
However, let’s re-examine what happens exactly.
- We can only detect all electrons if the light is high intensity, and high intensity does not mean higher energy photons but more photons. Indeed, if the light source is deem, then electrons might get through without being seen. So a high-intensity light source allows us to see all electrons but – as demonstrated not only in thought experiments but also in the laboratory – it destroys the interference pattern.
- What if we use lower-energy photons, like infrared light with wavelengths of 10 to 100 microns instead of visible light? We can then use thermal imaging night vision goggles to ‘see’ the electrons. 🙂 And if that doesn’t work, we can use radiowaves (or perhaps radar!). The problem – as Feynman explains it – is that such low frequency light (associated with long wavelengths) only give a ‘big fuzzy flash’ when the light is scattered: “We can no longer tell which hole the electron went through! We just know it went somewhere!” At the same time, “the jolts given to the electron are now small enough so that we begin to see some interference effect again.” Indeed: “For wavelengths much longer than the separation between the two slits (when we have no chance at all of telling where the electron went), we find that the disturbance due to the light gets sufficiently small that we again get the interference curve P12.” [P12 is the curve describing the original interference effect.]
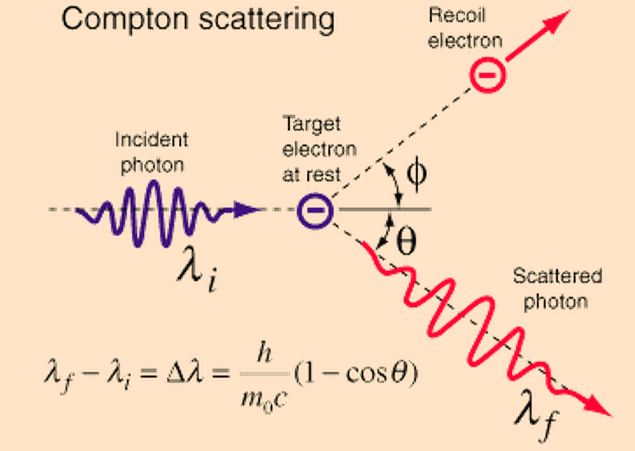
Now, that would suggest that, when push comes to shove, the Uncertainty Principle only describes some indeterminacy in the so-called Compton scattering of a photon by an electron. This Compton scattering is illustrated below: it’s a more or less elastic collision between a photon and electron, in which momentum gets exchanged (especially the direction of the momentum) and – quite important – the wavelength of the scattered light is different from the incident radiation. Hence, the photon loses some energy to the electron and, because it will still travel at speed c, that means its wavelength must increase as prescribed by the λ = h/p de Broglie relation (with p = E/c for a photon). The change in the wavelength is called the Compton shift. and its formula is given in the illustration: it depends on the (rest) mass of the electron obviously and on the change in the direction of the momentum (of the photon – but that change in direction will obviously also be related to the recoil direction of the electron).
This is a very physical interpretation of the Uncertainty Principle, but it’s the one which the great Richard P. Feynman himself stuck to in 1965, i.e. when he wrote his famous Lectures on Physics at the height of his career. Let me quote his interpretation of the Uncertainty Principle in full indeed:
“It is impossible to design an apparatus to determine which hole the electron passes through, that will not at the same time disturb the electrons enough to destroy the interference pattern. If an apparatus is capable of determining which hole the electron goes through, it cannot be so delicate that it does not disturb the pattern in an essential way. No one has ever found (or even thought of) a way around this. So we must assume that it describes a basic characteristic of nature.”
That’s very mechanistic indeed, and it points to indeterminacy rather than ontological uncertainty. However, there’s weirder stuff than electrons being ‘disturbed’ in some kind of random way by the photons we use to detect them, with the randomness only being related to us not knowing at what time photons leave our light source, and what energy or momentum they have exactly. That’s just ‘indeterminacy’ indeed; not some fundamental ‘uncertainty’ about Nature.
We see such ‘weirder stuff’ in those mega- and now tera-electronvolt experiments in particle accelerators. In 1965, Feynman had access to the results of the high-energy positron-electron collisions being observed in the 3 km long Stanford Linear Accelerator (SLAC), which started working in 1961, but stuff like quarks and all that was discovered only in the late 1960s and early 1970s, so that’s after Feynman’s Lectures on Physics.So let me just mention a rather remarkable example of the Uncertainty Principle at work which Feynman quotes in his 1985 Alix G. Mautner Memorial Lectures on Quantum Electrodynamics.
In the Feynman diagram below, we see a photon disintegrating, at time t = T3, into a positron and an electron. The positron (a positron is an electron with positive charge basically: it’s the electron’s anti-matter counterpart) meets another electron that ‘happens’ to be nearby and the annihilation results in (another) high-energy photon being emitted. While, as Feynman underlines, “this is a sequence of events which has been observed in the laboratory”, how is all this possible? We create matter – an electron and a positron both have considerable mass – out of nothing here ! [Well… OK – there’s a photon, so that’s some energy to work with…]
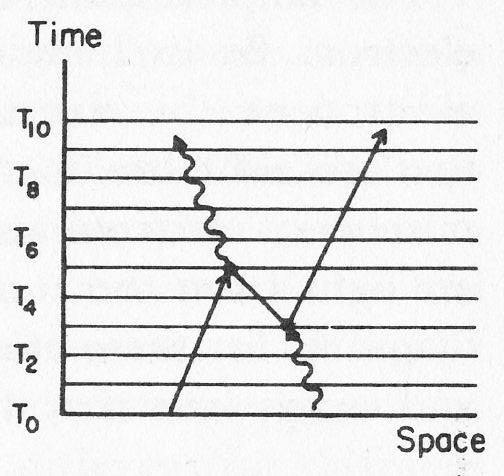 Feynman explains this weird observation without reference to the Uncertainty Principle. He just notes that “Every particle in Nature has an amplitude to move backwards in time, and therefore has an anti-particle.” And so that’s what this electron coming from the bottom-left corner does: it emits a photon and then the electron moves backwards in time. So, while we see a (very short-lived) positron moving forward, it’s actually an electron quickly traveling back in time according to Feynman! And, after a short while, it has had enough of going back in time, so then it absorbs a photon and continues in a slightly different direction. Hmm… If this does not sound fishy to you, it does to me.
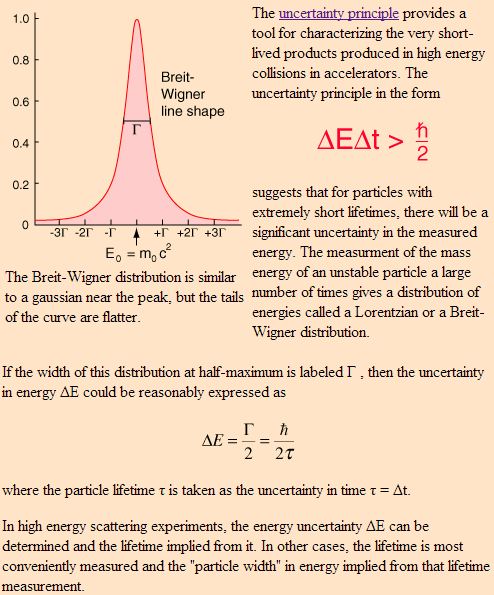
The more standard explanation is in terms of the Uncertainty Principle applied to energy and time. Indeed, I mentioned that we have several pairs of conjugate variables in quantum mechanics: position and momentum are one such pair (related through the de Broglie relation p =ħk), but energy and time are another (related through the other de Broglie relation E = hf = ħω). While the ‘energy-time uncertainty principle’ – ΔE·Δt ≥ ħ/2 – resembles the position-momentum relationship above, it is apparently used for ‘very short-lived products’ produced in high-energy collisions in accelerators only. I must assume the short-lived positron in the Feynman diagram is such an example: there is some kind of borrowing of energy (remember mass is equivalent to energy) against time, and then normalcy soon gets restored. Now THAT is something else than indeterminacy I’d say.
But so Feynman would say both interpretations are equivalent, because Nature doesn’t care about our interpretations.
What to say in conclusion? I don’t know. I obviously have some more work to do before I’ll be able to claim to understand the uncertainty principle – or quantum mechanics in general – somewhat. I think the next step is to solve my problem with the summary ‘not enough arrows’ explanation, which is – evidently – linked to the relation between energy and size of particles. That’s the one loose end I really need to tie up I feel ! I’ll keep you posted !
Some content on this page was disabled on June 16, 2020 as a result of a DMCA takedown notice from The California Institute of Technology. You can learn more about the DMCA here:
https://wordpress.com/support/copyright-and-the-dmca/
Some content on this page was disabled on June 20, 2020 as a result of a DMCA takedown notice from Michael A. Gottlieb, Rudolf Pfeiffer, and The California Institute of Technology. You can learn more about the DMCA here:
