
A sympathetic researcher, Steve Langford, sent me some of his papers, as well as a link to his ResearchGate site, where you will find more. Optical minerology is his field. Fascinating work – or, at the very least, a rather refreshing view on the nitty-gritty of actually measuring stuff by gathering huge amounts of data, and then analyzing it in meaningful ways. I learnt a lot of new things already (e.g. kriging or Gaussian regression analysis, and novel ways of applying GLM modelling).
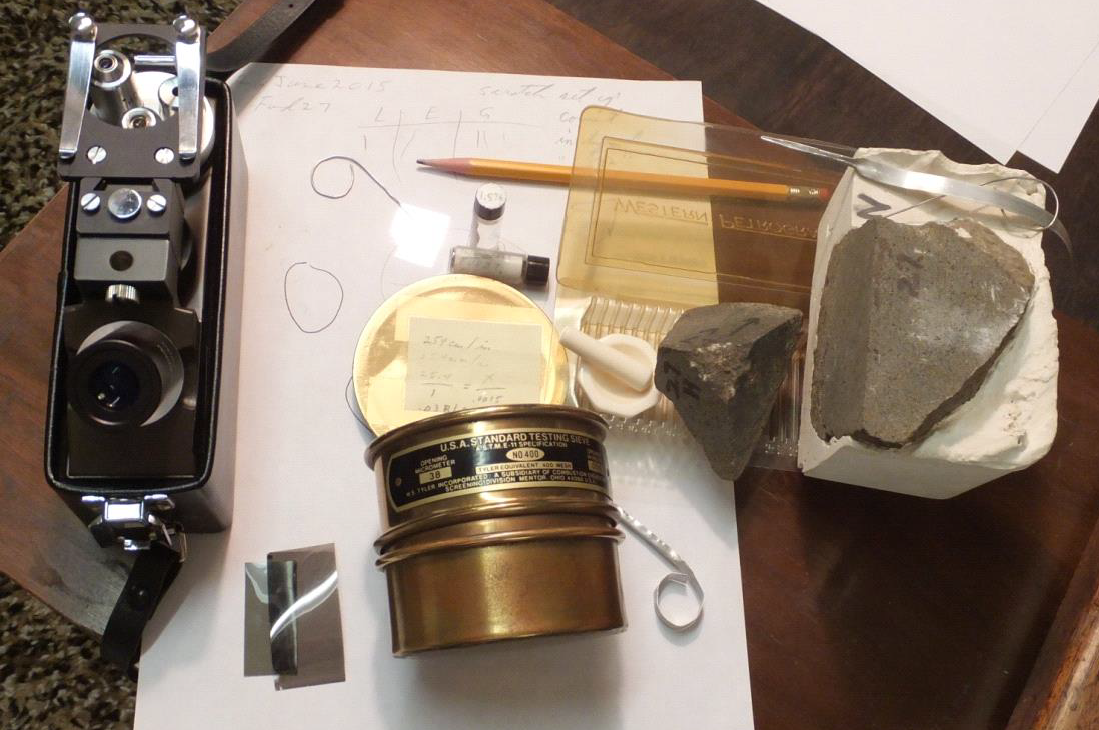
Dr. Langford wrote me because he wants to connect his work to more theory – quantum math, and all that. That is not so easy. He finds interesting relations between temperature and refractive indices (RIs), as measured from a single rock sample in Hawaii. The equipment he used, is shown below. I should buy that stuff too! I find it amazing one can measure light spectra with nanometer precision with these tools (the dial works with 0.1 nm increments, to be precise). He knows all about Bragg’s Law and crystal structures, toys with statistical and graphical software tools such as JMP, Surfer, and talks about equipping K-12 level students with dirt-cheap modular computer-connected optical devices and open software tools to automate the data gathering process. In short, I am slightly jealous of the practical value of his work, and the peace of mind he must have to do all of this! At the very least, he can say he actually did something in his life! 🙂
Having showered all that praise, I must admit I have no clue about how to connect all of this to quantum effects. All I know about temperature – about what it actually is (vibrational motion of molecules and atoms within molecules, with multiple degrees of freedom (n > 3) in that motion) – is based on Feynman’s Lectures (Chapters 40 to 45 of the first Volume). Would all that linear, orbital and vibrational motion generate discernible shifts of spectral lines? Moreover, would it do so in the visible light spectrum (X-rays are usually used – increases measurement precision – but such equipment is more expensive)? I have no idea.
Or… Well, of course I do have some intuitions. Shifts in frequency spectra are well explained by combining statistics and the Planck-Einstein relation. But can we see quantum physics in the data? In the spectral lines themselves? No. Not really. And so that’s what’s got me hooked. Explaining a general shift of the frequency spectrum and discerning quantum effects in RIs in data sets (analyzing shifts of spectral lines) are two very different things. So how could we go about that?
Energy is surely quantized, and any small difference in energy must probably translate into small shifts of the frequencies of the spectral lines themselves (as opposed to the general shift of the spectrum as such, which, as mentioned above, is well-explained by quantum physics) respecting the Planck-Einstein relation for photons (E = hf). I do not know if anyone tried to come up with some kind of quantum-mechanical definition of the concept of entropy, (but I have not googled anything on that, so I expect there must be valuable resources on that out there), and Boltzmann’s constant was re-defined at the occasion of the 2019 revision of the SI system of units – and a careful examination of the rationale of that revision or re-definition should yield deeper insights in this regard, especially because I think that revision firmly anchors what I refer to as a realist interpretation of quantum physics. Thermal radiation is microwave-range radiation, so a 0.1 nm resolution should be enough to capture a shift in spectral lines – if it is there, that is.
I need to think on this. As for now, I look at Langford’s work as art, and one of his interests is, effectively, to connect art and science. Let me quote one of his commentaries on one of his images: “Light and matter dance at 30°C, upon what is essentially a Calcium-Silicate substrate through which light and various chemicals flow. Swirling Yin-Yang patterns reminiscent of Solar flares and magnetic lines of force also remind me of fractal patterns.” [My italics.]
He does phrase it very beautifully, doesn’t he? Maybe I will find some deeper meaning to it later. Dr. Langford’s suggestion to re-phrase quantum-mechanical models in terms of Poynting vectors is one that strikes a note, and there are other ideas there as well. It must be possible to find quantum-mechanical effects by further analyzing, for example, the relation between temperature and RIs, indeed – and to use the formal (consistent and complete!) language of quantum mechanics to (also) explain Dr. Langford’s findings. This would conclusively relate the micro-level of quantum physics to the macro-level of crystals (isotropic or anisotropic structures), and it would not require supercooled condensates or massive investments in new accelerator facilities.
It would also provide amateur physicists with a way to discover and verify all by themselves. That would be a great result in itself. 🙂
Post scriptum (27 March): Looking at the papers again, I do not see a shift in spectral lines. Spectral lines correspond to differences between quantized energies in electron orbitals. These are either atomic orbitals or molecular orbitals (valence electrons), and shifts between orbitals corresponds to spectral lines in the visible spectrum (Rydberg-scale energies) or, in case of molecular orbitals, microwave photons being absorbed or emitted. Temperature just increases the intensity of photon beams going in and out of the system (the rock sample, in this case), and so it causes a shift of the spectrum, but the lines are what they are: their energy is and remains what it is (E = hf). Of course, the superposition principe tells us the energies of microwave and visual-spectrum energies can combine in what resembles a normal distribution around a mean (which, yes, shifts with temperature alright).
As for the gist of the matter, yes, of course, what Dr. Langford is seeing, are quantum-mechanical effects alright.
Post scriptum (9 April 2021): In the preceding week, I found that Dr. Langford seems to find my math too difficult, and turns to pseudo-scientists such as Nassim Haramein, and contributes to Haramein’s Resonance Science Foundation. I dissociate completely from such references and like associations. Everyone is free to seek inspiration elsewhere, but Haramein’s mystical stories are definitely not my cup of tea.

3 thoughts on “Temperature, RIs, and spectral lines”